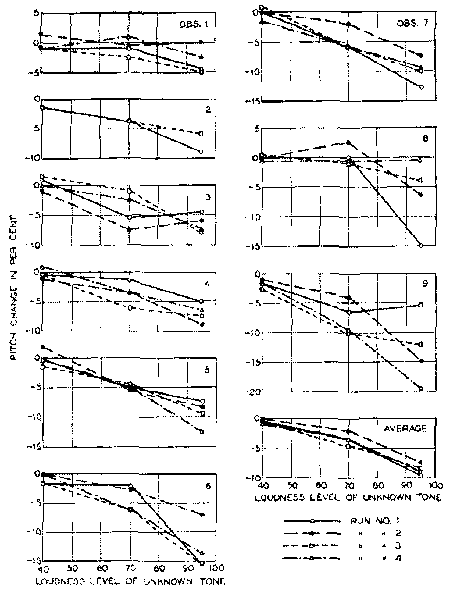
Figure 1. Effect of practice. Results of the 9 observers on four successive tests at 100 cycles using head receivers as sound source.
Originally published in the Journal of the Acoustical Society of America, 8(1), 14-9, 1936.
William B. Snow, Bell Telephone Laboratories
The changes in pitch which result from changes in the loudness of low frequency tones were investigated for several frequencies between 75 and 1000 c.p.s. with a crew of 9 observers. The loudness levels covered the range 20 to 120, and both telephone receivers and a loudspeaker were used as sound sources. Fletcher's pitch standard, a pure tone of loudness level 40, Was employed. All consistent judgments gave pitch shifts downward with increasing loudness, but large differences between individuals were found. Two observers perceived no shifts at any frequency or loudness while three others experienced changes greater than 35 percent at the highest intensity. Appreciable changes with tune in individual judgments were found. There appeared insignificant difference between data obtained with telephone receivers or with the loudspeaker. A set of contours of equal loudness level, plotted on coordinates frequency and pitch change in percent, is given. These curves show a pitch change small at 1000 cycles, increasing to maximum at a low frequency and decreasing for still lower frequencies. The frequency of greatest shift increased from about 100 cycles at sirrall loudness to about 200 at loudness level 120. The Appendix describes automatic test equipment that greatly simplified the testing routine and improved its accuracy.
The pitch of a low frequency tone is not a constant uniquely determined by the frequency. It decreases when the loudness of the tone is increased. This phenomenon has been studied quantitatively by Zurmühl in Germany and Stevens at Harvard. Zurmühl presented results for a number of observers covering frequencies from 200 to 3000 cycles and loudness levels up to 80. In determining the relative pitch his observers listened alternately to two tones maintained at constant loudness difference and varied the frequency of one tone until both sounded of equal pitch. His results indicated a marked variation between observers, and an apparent frequency of maximum pitch change at. about 200 cycles, although he states that there is doubt about this conclusion. Stevens' described tests of one observer at frequencies from 150 to 12,000 cycles and loudness levels between 30 and 110. He presented to the observer alternate tortes differing slightly in frequency and one was varied in loudness until the two sounded equal in pitch. A maximum pitch change at 200 cycles was not suggested by these data. Fletcher' discussed the need for a standard of reference for pitch and suggested a pure tone of 40 loudness level, the unknown tone to he compared with this tone, and the frequency of the reference tone sounding equal in pitch to the unknown to be taken as the latter's pitch.
The loudspeakers used in the Washington demonstrations of stereophonic reproduction in 19334 furnished a sound source capable of supplying very loud low frequency sounds with small harmonic distortion, and since this end of the range had been left unstudied mainly for lack of this type of sound source the tests upon pure tones here reported were undertaken. 'T'he objectives were to investigate the differences between observers; to determine representative relations between pitch, loudness and frequency for the frequency range below 500 cycles and loudness level range 20 to 120; and to discover any differences that might appear between clat.a obtained with loudspeakers and with telephone receivers.
The tones were presented to the observers either through a pair of telephone receivers or a loudspeaker. The receiver loudness levels were obtained from the calibration published by Fletcher and Munson in connection with their loudness studies.' The loudness levels from the loudspeaker were established for the first tests by balancing against the receivers, and for the following tests by measuring the pressures near the ears with a condenser microphone. Both sound sources were known to produce harmonic distortion 30 or more db below fundamental output for the frequencies and levels at which they were used. A reference tone of loudness level 40 was adopted following Fletcher's suggestion and the method of constant stimuli was employed as a testing technique. A fuller description of the equipment and testing method is given in the Appendix.
At a first trial of the method three observers tested three frequencies using the receivers. Next the output. of the loudspeaker was balanced for loudness against the receivers, and the tests were repeated using it as a sound source. The averaged results appear in Table I. The pitch, it will be remembered, is defined as the frequency of a pure tone of loudness level 40 which sounds equal to the unknown in pitch. No significant differences appeared between loudspeaker and receiver results; so the data were averaged to give the pitch change percentages shown in the last three columns. This percentage represents the change in pitch as the tone is changed from a loudness level of 40 to the indicated level, and is a convenient value to use in comparing the effect at various frequencies. Numerically it is the difference in frequency of the unknown and comparison tones of equal pitch, expressed as a percentage of the frequency of the unknown tone. The data indicate that there is a greater shift at 100 cycles than at 200, and very little at 1000 cycles.
TABLE 1. Pitch of pure tones. Average of results of observers 4, 5, 7.
| 100 pitch | 200 pitch | 1000 pitch | Average pitch change (%) | ||||||
| Frequency (cps) loudness level | LS | Rec | LS | Rec | LS | Rec | 100 | 200 | 1000 |
| 110 | - | - | 178 | 179 | 987 | 992 | - | -11 | -1.05 |
| 100 | 87 | 88.5 | 191 | 189 | 985 | 993 | -12.5 | -5 | -1.1 |
| 80 | 93 | 94 | 193 | 191 | 993 | 998 | -6.5 | -4 | -0.45 |
| 60 | 96 | 95.5 | 198 | 196 | 998 | 1004 | -4 | -1.5 | 0.1 |
| 40 | 99 | 100 | 201 | 201 | 1000 | 999 | -0.5 | 0.5 | -0.05 |
| 40 | 99 | 100 | 201 | 202 | - | 1001 | -0.5 | 1 | - |
| 20 | 100 | 102.5 | 201 | 203 | 1003 | 1002 | 1.5 | 1 | 0.25 |
Following these tests balances were made by 9 observers with the twin objectives of determining- the consistency of their judgments and giving them practice. The receivers were used, and four identical and successive runs were made at 100 cycles and loudness levels of 40, 70 and 95. All of the observers were thoroughly experienced in auditory observation, but. in this type of balance had previously participated in only a few tests about the equivalent of two of the present runs. Of course observers 4, 5 and 7 had the additional practice gained in the tests of Table I. Observers 2 and 3 had had formal musical training.
The results are plotted in Fig. 1. No consistent practice trends are evident and the group averages show only small variations. Inspection of the curves reveals wide variations in an individual's judgment from time to time and appreciable variations among the testers in the spreads of their results. On the whole, observers 4, 5 and 7 who were most experienced show the smallest spreads. The actual pitch change is seen to be very different for different persons, but this point is better illustrated by the following tests.
Figure 1. Effect of practice. Results of the 9 observers on four successive
tests at 100 cycles using head receivers as sound source.
The final set of balances employed the loudspeaker as a sound source and the same crew of 9 observers. Fig. 2 exhibits the results of these experiments. A very striking feature of this plot is the variation of the pitch change effect among the observers, with observers I and 2 hearing no appreciable pitch change over a loudness level range of 100 and observer 6 registering a one-octave shift at 120 loudness level and 240 cycles_ At this frequency the crew seems to divide into a "shift" group, 5, 6, 7, 8, 9 and a "small-shift" group, 1, 2, 3, 4. The pitch change proceeds at a moderate pace up to 105 loudness level, and then increases suddenly to almost an octave for the three observers, 6, 7, 9, at loudness level 120 (app. 300 bars). Observer 5 shows a similar sudden change at 140 cycles although his absolute judgment is almost equalled by 6 and 9.
At 75 cycles, which the observers found most difficult to balance, there seems a consistent and an erratic group. Observer 8 stated that he received very little sense of pitch from this tone, while observer 9 felt that he was influenced by the rhythm of the tone as well as by his sense of its pitch.
The observers spread fairly uniformly over the whole range between no shift and maximum at 140 cycles. Apparently if an observer experiences a pitch change at all it is near this frequency.
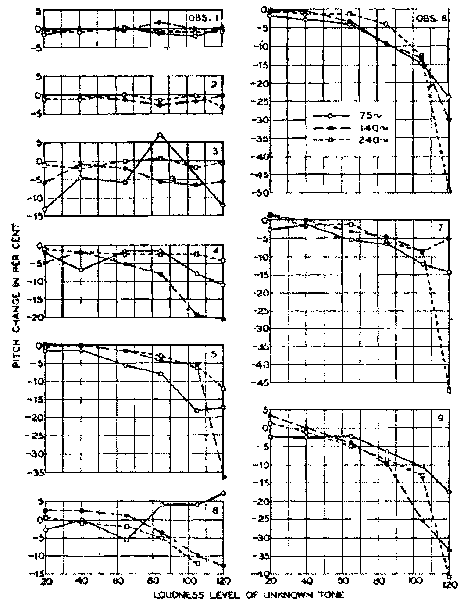
Figure 2. Effect of loudness level. Results of the 9 observers out tests at 3
frequencies using the loudspeaker as sound source.
Fig. 3 shows average results for the whole crew and Fig. 4 for the four observers, 5, 6, 7, 9, who obtained the largest shifts. To each plot is added the curve showing the results of the receiver tests at 100 cycles. In both cases below loudness level 105 the pitch change increases as the frequency decreases to 100 cycles. The 75-cycle curve, however, lies above the 100-cycle even though it seems to suffer from a downward displacement of about two percent at the equal-loudness point. Since the frequencies in this region were known within 0.2 cycle the dislocation is ascribed to some unexplained idiosyncrasy of the technique. Above 105 loudness level the frequency of maximum shift becomes 240 cycles and the amount of the shift increases rapidly.
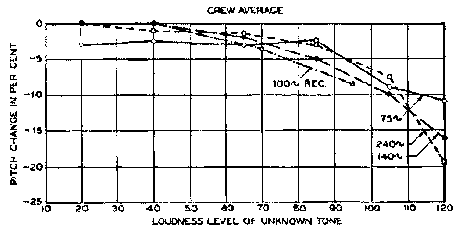
Figure 3. Effect of loudness level. Average of results of the 9 observers.
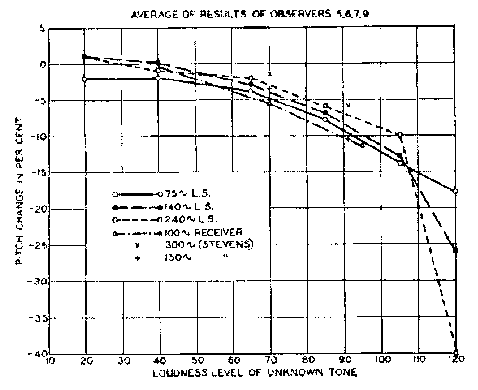
Figure 4. Effect of loudness level. Average of the results of 4 observers
perceiving greatest shifts.
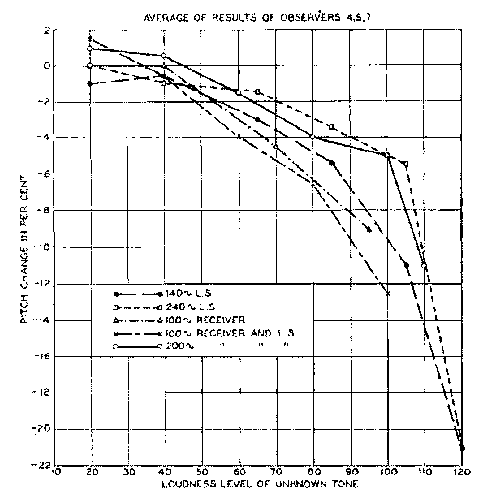
Figure 5. Consistency of results. Average of the results of 3 observers taking
part in all tests. Curves labelled "Receiver and L.S." plotted from Table 1.
The data published by Stevens [2] were for his single observer who was the most consistent and obtained the largest shifts. Certain of his results were transposed to a loudness level 1. axis and are shown on the plot for the four most consistent observers who in this instance also obtained the Iargest shifts (Fig. 4). The agreement is considered good, especially gratifying because the two sets of data were taken with "opposite" techniques. In Stevens' tests the comparison tone was varied in loudness, whereas in the tests of this paper the frequency of the standard was changed.
It. is interesting to examine the results of observers 4, 5 and 7 who participated in all tests. Fig. 5 shows this comparison. Keeping in mind the variations shown by Fig. 1, the agreement is considered satisfactory. In particular, while no 120 loudness level was tested at 200 cycles on the first tests, the data at 110 loudness level indicatethe sudden increase of pitch change at high levels which was an outstanding feature of the later results.
An attempt to draw a comprehensive set of curves showing the average relation between pitch change, frequency, and loudness level at low frequencies requires a generous admixture of judgment with the experimental evidence. Nevertheless the attempt has been made because it is felt that enough is known to determine the general shape of the curves and their approximate absolute positions. Fig. 6 is drawn with contours of equal loudness level plotted on coordinates frequency and pitch change in percent. All the data available were considered in deriving these curves and were weighted according to the judgment of the author. The frequency of maximum shift appears to become higher with increasing loudness, but remains near 100 cycles except for the very loud tones.
Most observers perceive a lowering of the pitch of a low frequency pure tone as the tone is increased in loudness. A few do not, but probably none consistently observe a pitch increase. Shifts may be as high as 50 percent for extreme loudnesses, with observers spreading throughout the range from 0 to maximum.
The same pitch changes are observed in an open sound field as with head receivers for the same loudness levels.
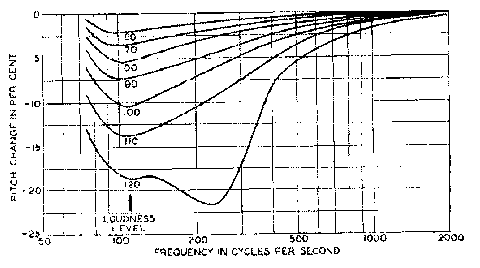
Figure 6. Contours of constant loudness level.
Curves show the amount by which the pitch of a pure tone of any frequency is shifted as the tone is raised in loudness level from 40 to the level of tile contour. Example: A 100-cycle tone will be changed ten percent downward in pitch if raised from loudness level 40 to loudness level 100, but a 500-cycle tone will be changed only two percent for the same loudness level increase.
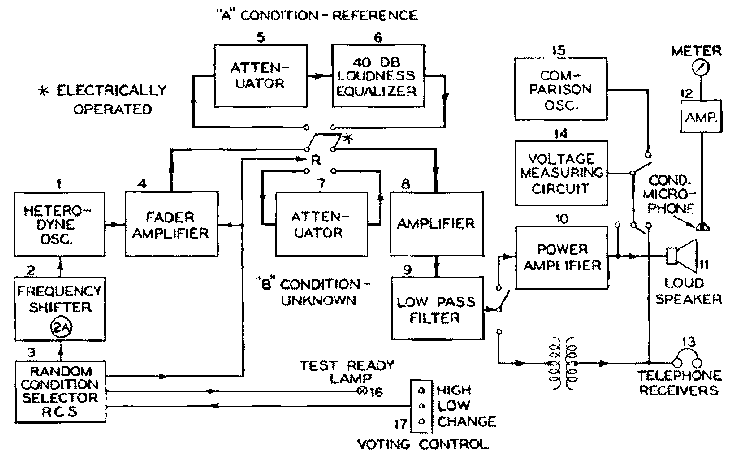
Figure 7. Circuit diagram.
The pitch changes described herein may seem appallingly large if all factors entering tone production and combination are not appreciated. It must be kept in mind that pure tones of the high loudness levels used in these tests are difficult to produce arid seldom if ever occur in music where pitch perception is of most importance. Complex tones exhibit much smaller changes in pitch than pure tones of like frequency. To one desiring the proper perspective in considering these data a careful study of the sections on pitch in Fletcher's [3] papers is recommended.
The testing method adopted was the "AB" test. With this technique the observer heard pairs of tones; each pair consisted of the reference tone of 40 loudness level but variable frequency followed by the unknown tone of fixed frequency and loudness; the observer voted as to whether the first was of higher or lower pitch than the second, no equal judgments being allowed. For each judgement 35 pairs were presented, 7 reference tone frequencies 5 times each in random order. The results were plotted, reference tone frequency vs. "votes higher," and the reference tone frequency at which the curve crossed 50 percent was called the pitch of the unknown tone. This type of measurement is tedious and liable to error if the circuit settings must be made by an operator, but for these tests automatic equipment was used which made it rapid and simple.
With reference to Fig. 7 both tones were generated by the oscillator, 1, controlled by the frequency shifter, 2. This device caused the frequency on the B, or unknown,condition to be constant, whereas on the .1, or reference, condition it had any one of seven frequency steps selected by the Random Condition Selector (RCS)3. The steps used were 3 cycles wide at 75, 100 and 240 cycles, 2 at 140 cycles, and 5 at 1000 cycles. I3y means of dial 2A the middle frequency of the group of steps could he shifted manually ~100 cycles from the frequency of the B condition. The fader amplifier, 4, started and stopped the tones slowly so that there were no clicks. Switch R connected into the circuit either attenuator 5 and equalizer 6 for the A condition or attenuator 7 for the B condition. The equalizer maintained the A tone at 40 loudness level regardless of the frequency. From here the tones were further amplified (R) and filtered (9) before entering either the power amplifier, 10, and loudspeaker, 11, or the transformer and telephone receivers, 13, according to the particular test. Voltages on the sound producers were measured by 14, while the loudspeaker output was measured by microphone and amplifier, 12. Comparison oscillator 15 was used to check the frequencies of the two tones by means of heats. The RCS, 3, controlled the presentation of tones and was in turn controlled by the observer through the voting control, 17. When the circuits were ready the operator lighted the lamp, 16, signalling the observer to start. The observer pressed the "change" button which caused the RCS to select a comparison frequency, set it up on the oscillator, and present the tones in the correct order. Satisfactory timing was found to be: reference tone I second, silence 0.5 second, unknown tone 1.5 seconds, silence 2 seconds. The observer listened to the tones usually only once, and pressed either the "high" or "low" button, which caused the RCS to stop the tones and record the vote on the electrical counter corresponding to that frequency step. When the change button was again pressed another condition was selected and presented. For the first few judgments the operator disconnected the RCS from the frequency shifter and manually adjusted dial 2A until an approximate balance point was found, at which time the automatic feature was restored and the machine proceeded until 35 conditions were selected in random order. The operator tried to make the manual adjustment in such a manner that the observer could not tell w hen the switch to automatic operation was made. No votes were recorded during the trial balance, of course. A photograph of the equipment in Fig. 8 shows at the left the voltage measuring set, frequency shifter, oscillator, and fader amplifier in order above the shelf, with the RCS, attenuators and switching equipment similarly arranged on the right. The operator is shown making the preliminary adjustment with dial 2A as he watches lamps indicating the observer's votes. During the tests two RCS's were used. One has been described in a preceding paper [6] The other, used most and illustrated, performed similar functions but the condition selecting mechanism was simplified. It consisted of a telegraph tape sender, using a large number of tapes on each of which were punched the 35 conditions selected at random, lottery style. The tape is clearly visible in the machine.
The final set of balances employed the loudspeaker as a sound source primarik because this was necessary in order to obtain loudness levels above 100 at frequencies below 150 cycles. In addition, the observers were subjected to more uniform conditions of loudness than is possible with head receivers. While with a reasonable sized crew of observers the variations introduced by receiver calibration may be expected to cancel, with the loudspeaker at these low frequencies each observer was subjected to a known and identical sound field which eliminated one source of uncertainty in the results. Exen though the loudspeaker was located in the "deadest" room available. sound reflections caused its characteristic to vary as much as dl, with frequency and this caused the comparison tone loudness to vary. Irregularities introduced by this cause are considered small compared to the inherent errors illustrated by Fig. 1. Since the frequency of the unknown tone was constant and accurately maintained all observers heard it at the same intensity. The loudspeaker with observer in position appears in Fig. 9, wherein the "test ready" lamp and voting control with three buttons are clearly visible.
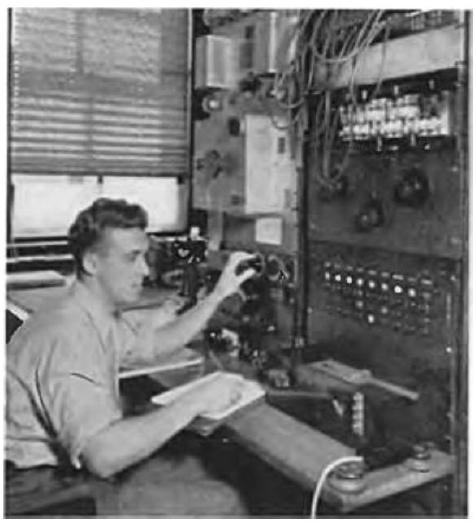
Figure 8. Tone generating and control equipment.
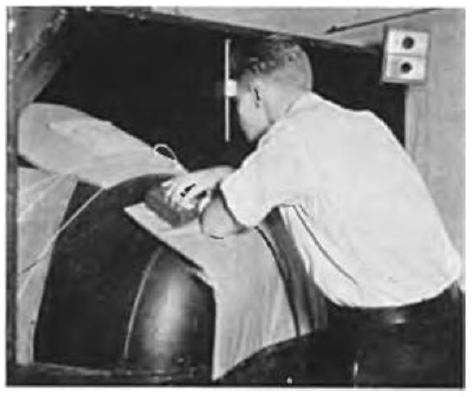
Figure 9. Low frequency loudspeaker sound source.
This paper was presented at the Cambridge Meeting of the Acoustical Society of America, December 6 and 7, 1935.
1. G. Zurolllhl, Zeits. f. Sinnesphysiol. 61, 40-80 (1930).
2. S. S. Stevens, J. Acous. Soc. Am. 6, 150-154 (1935).
3. H. Fletcher, J. Acous. Soc. Ain. 5, 59-69 (1934); J. Frank, Inst. 220,
405-429 (1935)
4. "Auditory Perspective-- A Symposium,'' Elect. Eng. 53, 9 32, 216-218 (1934).
5. H. Fletcher and W. A. Munson, J. Acous. Soc. Aim 5, 82-108 (1933).
6. W.A. Munson and J. C. Steinberg. Paper presented orally at the Pittsburgh
Meeting of the A. S. A., December 1934, and to be published shortly.
![]()