The attributes of tones.
Originally published in Proceedings of the National
Academy of Sciences, Volume
20, pages 457-9, 1934.
S.S. Stevens
Department of Psychology, Harvard University
It has long been known that the interaction of a sound stimulus with the
human auditory mechanism gives rise to the two discriminatory responses known as
pitch and loudness. In addition to these two responses we must recognize tonal
volume, first studied by Rich [1] in 1916, and tonal density. These four
discriminable attributes are all functions of the two dimensions of the
stimulus, frequency and energy. It is the purpose of this paper to discuss the
nature of these functions as experimentally determined.
The method used by Kingsbury [2] to determine the well-known equal loudness
contours was employed to determine similar isophonic contours for pitch, volume
and density. Two tones of different frequency were presented alternately to an
observer who was allowed to vary the energy of one of the tones until the two
tones sounded equal in respect of the attribute in question. This procedure
yields, in the case of loudness, contours having a minimum near the middle of
the audible range. A part of one of these contours is shown in figure 1.
When the observer is asked to make two tones of different frequency sound
equal in volume (meaning "bigness" or spread), he increases the intensity of the
higher tone by an amount which depends upon the intensity level of the standard
tone. The results of a series of equations of this type are shown by the curve
marked "volume" in figure 1. This curve is the smoothed average of the results
obtained from four observers by having them match each tone to a standard ten
times. The average percentage variation of these equations, as measured in terms
of the voltage across the output of the audio-oscillator, was 7.9.
When instructions are given for the observer to make the two tones equal in
density, the procedure is reversed. The lower tone has to be made more intense,
as is shown in figure 1. The observers were able to make these judgments with a
percentage variation of 8.8. Furthermore, the introspective reports show that
both volume and density are judged with a high degree of subjective certainty.
Some observers insisted that no greater certainty attended their judgments of
loudness itself. However, the percentage variation obtained from a series of
equations for loudness was 6.9, a value which is slightly lower than those cited
above for volume and density.
It should be noted that it is a very simple matter to convey to a naive
observer what is meant by volume and density by presenting him with a high tone
at about 4000 cycles and asking him to note its "smallness" (volume) and its
"compactness" or "concentration" (density) and to contrast these characteristics
with those of a low tone at about 200 cycles. The difference is at once obvious.
It has generally been supposed that pitch is dependent solely upon the
frequency of the stimulus, although several investigators have reported slight
changes in pitch as the energy of the stimulus is altered. A systematic study of
this effect was made by Zurmühl [3] for frequencies ranging between 256 and 3072
cycles. Zurmühl found that an increase in the intensity of the stimulus caused a
drop in the pitch. The percentage of decrease was more for low tones than for
high. There was, in fact, almost no change in the pitch of the 3072-cycle tone.
The writer has been able to verify these facts by having observers adjust the
intensity of one of two tones of different frequency until the two tones are
subjectively equal in pitch. It appears, however, that the pitch of a tone of
4000 cycles goes up and not down when there is an increase in the energy of the
stimulus (see Fig. 2).
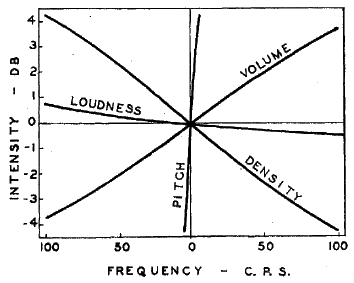
Figure 1. Isophonic contours representing equal pitch, loudness, volume
and density of tones equated to a standard tone of 500 cycles and 60 dB. Thus
0-frequency = 500 cycles; 0-intensity = 60 dB above the auditory threshold. The
pitch contour almost coincides with the 0-vertical when plotted to this scale;
but see figure 2 for the magnitude of its deviation.
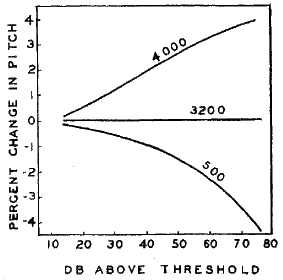
Figure 2. Change in pitch of tones at 500, 3200 and 400 cycles as a
function of intensity of the tones. Intensity is in dB. above the auditory
threshold. The change of pitch is measured by the percentage change in frequency
that must be made in order to counteract the change of pitch.
This reversal of the pitch effect at high frequencies occurred for all three
of the observers and suggested that a frequency could be found at which there
would be no change of pitch. Thus, by using a variation of the method of
constant stimuli, the frequency at which pitch remains constant for all values
of energy was found to lie between 3100 and 3300 cycles for these observers. It
is significant that in this range of frequencies the sensitivity of the ear is
maximal.4 In other words, the pitch of a tone is shifted away from the region of
greatest sensitivity when the intensity of the tone is increased and toward the
region of greatest sensitivity when the intensity is decreased.
We have, then, four distinct types of discriminatory response, all of which
arise from the interaction of a two-dimensional acoustic stimulus with a
multi-dimensional nervous system. With the method employed in these experiments
the observer performs a role analogous to that of a null instrument. He is `set"
or "tuned" by the experimenter's instructions to respond to a difference in a
certain aspect of his experience and then the stimulus is adjusted until he
ceases to notice a difference. The important point is that the observer can be
"tuned" in four different ways. The fact that each type of instruction leads to
a response which is a function of the two stimulus variables means that the
system can be thought of as bidimensional, but the fact that there are four
different types of response means that it should be possible to discover at
least four distinguishing characteristics in the neural pattern emanating from
the cochlea by the auditory nerve. There is evidence to show that two separate
auditory excitations can differ in respect of their position on the basilar
membrane, the number of fibres excited, the spread of this excitation and the
ratio of active to inactive fibres within the area excited.. If these factors
could be correlated with pitch, loudness, volume and density, respectively, the
solution of the problem of hearing would be greatly furthered.
Footnotes
1. G. J. Rich, J. Exper. Psychol., 1, 13-22 (1916).
2. B. A. Kingsbury, Phys. Rev., 29, 588-600 (1927).
3. G. Zurmiihl, Z. f. Sinnesphysiol., 61, 40-86 (1930).
4. L. J. Sivian and S. D. White, J. Acous. Soc. Amer., 4, 288-321. (1933).
